
Printer Fleet Manager - User Guide
Product: ModuleSmith Printer Fleet Manager (PFM) Module version: 19.0.7.1.1 Platform: Odoo 19.0 (Community or Enterprise) Audience: Daily operators - help-desk staff, office managers, print-room technicians Support: [email protected]
1. About this guide
This guide is for the people who use Printer Fleet Manager every day: watching
the fleet, reacting to alerts, changing toner, logging service, and running the
usage reports. It assumes the module is already installed and that an
administrator has configured discovery, SNMP polling, and alerting. For those
setup tasks, see the Administrator Guide and the Installation & Setup
Guide (pfm-INSTALL.md).
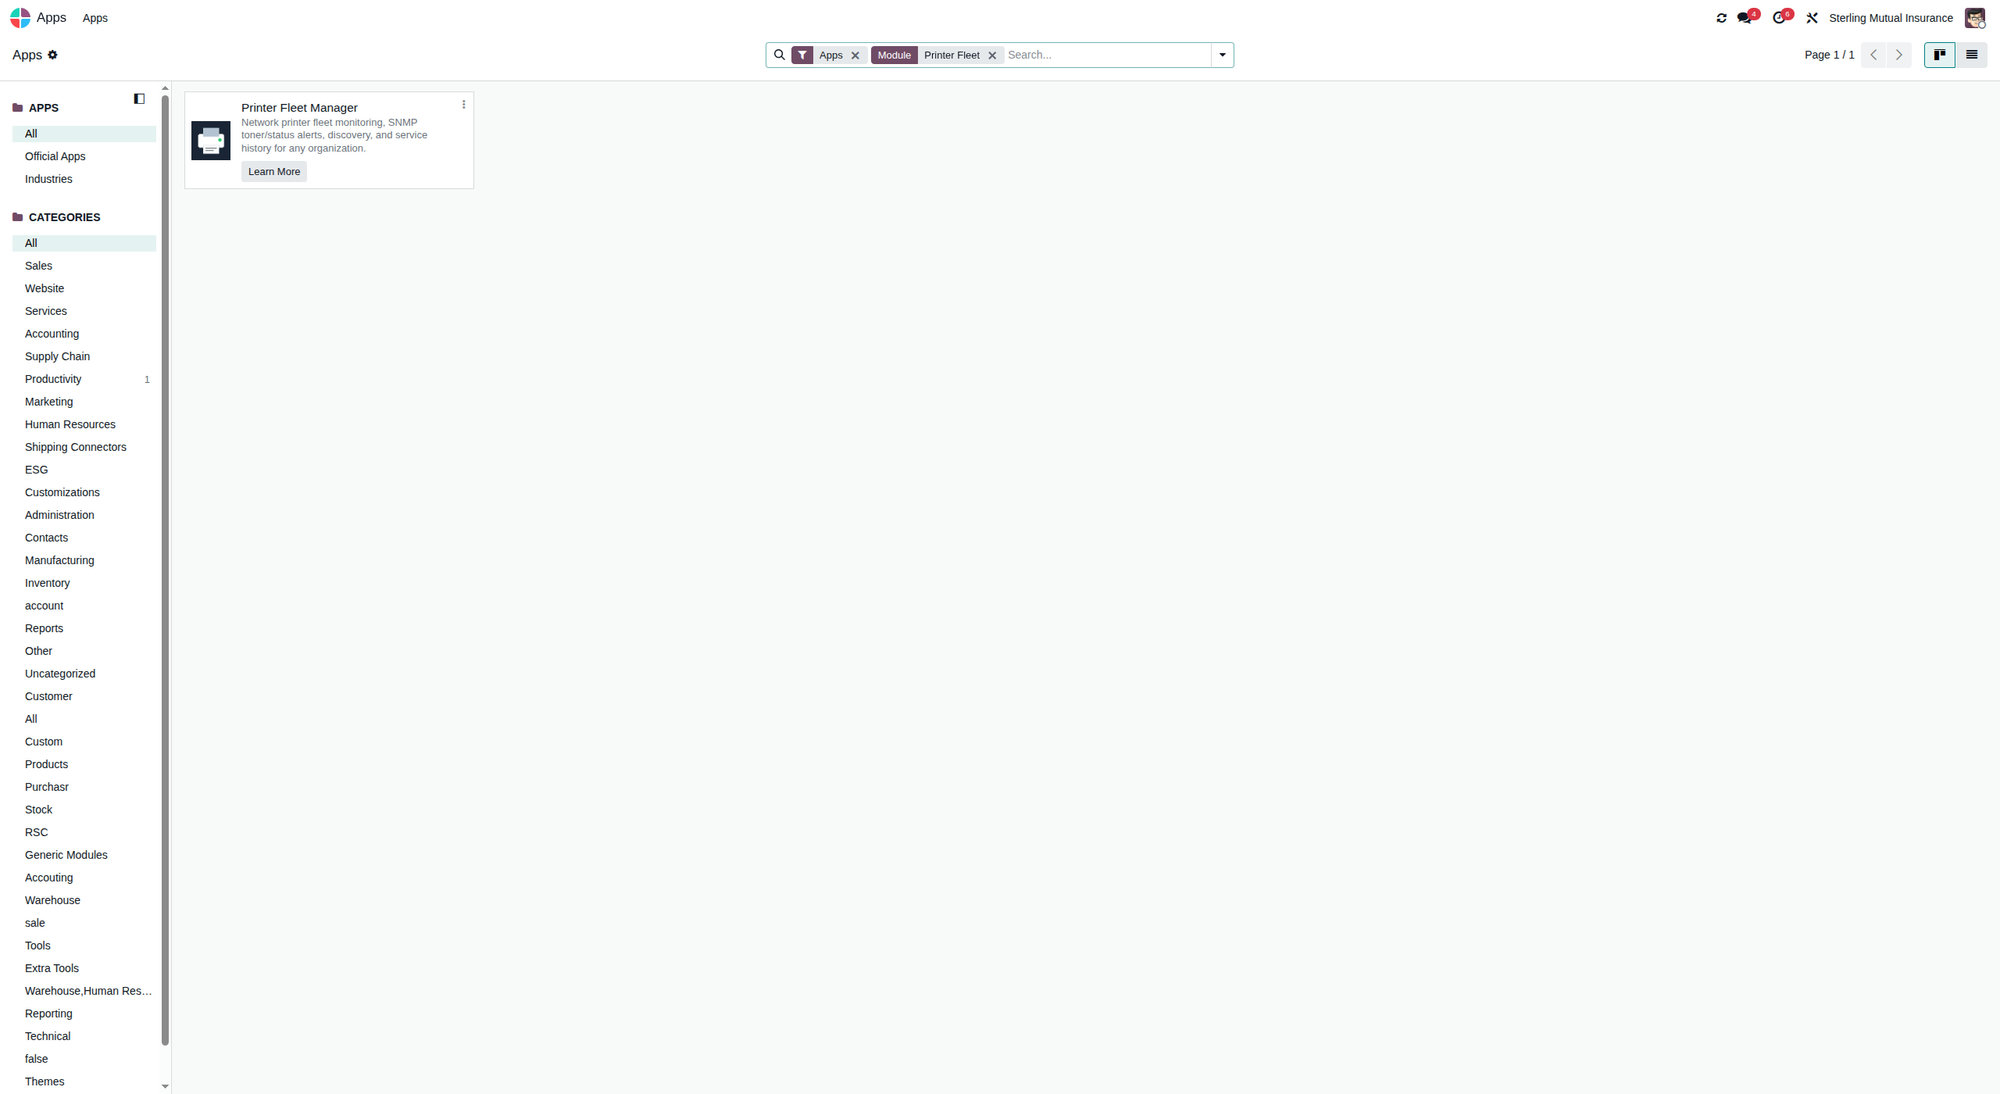
Everything in this guide lives under the Printer Fleet application in the Odoo main menu.
Two roles. Most operators are Printer Users - you can view the fleet, work alerts, and log service. A few tasks (running network scans, adding a newly discovered device, editing configuration) require the Printer Manager role. Where a task needs a manager, this guide says so.
2. The menu at a glance
Open Printer Fleet from the Odoo apps menu. The left-hand menu is organised into five groups:
| Menu group | What lives there |
|---|---|
| Dashboard | The at-a-glance fleet view (kanban / list) |
| Site Rollup | One row per site with status and supply summaries |
| Management | Printers, Sites, Network Scanner, OID Profiles |
| Monitoring | Supplies Grid, Alerts, Print Jobs, Low Toner Report, Reorder Report, Service History, Usage Report, Volume Trend, Service Costs, Status History, My Notifications |
| Configuration | Settings, Printer Areas, Alert Thresholds, Notification Subscriptions, SMS Backends, Licensing (manager-only) |
| Help / Manual | In-app help and the built-in manual |
3. The Dashboard
Printer Fleet → Dashboard
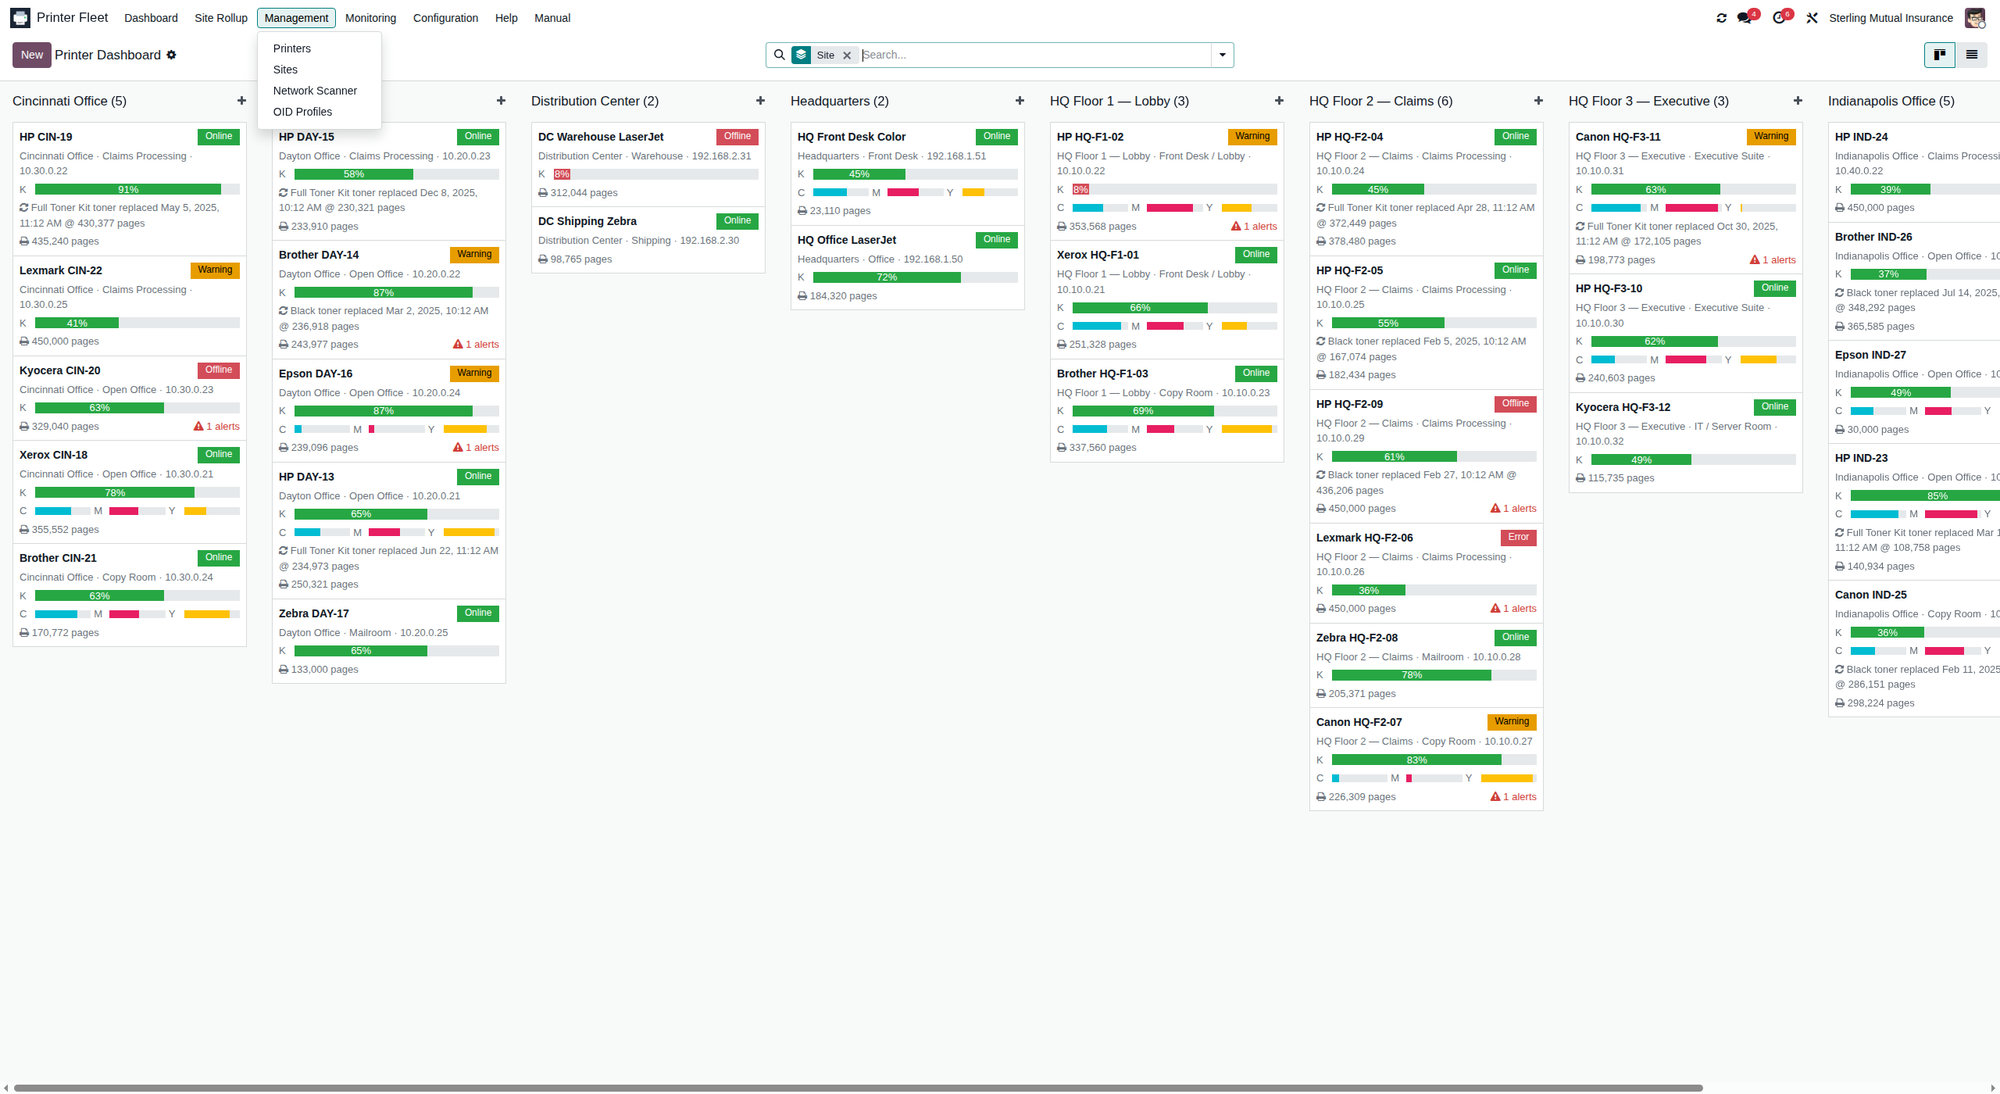
The dashboard is your daily starting point. It opens as a list by default and switches to a kanban card view with one card per printer.
3.1 Kanban cards
Each card shows the printer's name, site/area, live status, and toner bars. Status is shown with a coloured badge:
- 🟢 Online - reachable and healthy
- 🔴 Offline - the reachability check to the printer's port failed
- ⛔ Error - the device reported an error condition
- ⚠️ Warning - a non-fatal condition (e.g., low supply)
- ❔ Unknown - not yet polled
Toner is shown as a percentage bar for black (K) and, on colour devices, for cyan (C), magenta (M), and yellow (Y). A value of "Unknown" means SNMP has not yet returned a level for that supply. If a printer has open alerts, a 🚨 badge shows the count.
3.2 List view
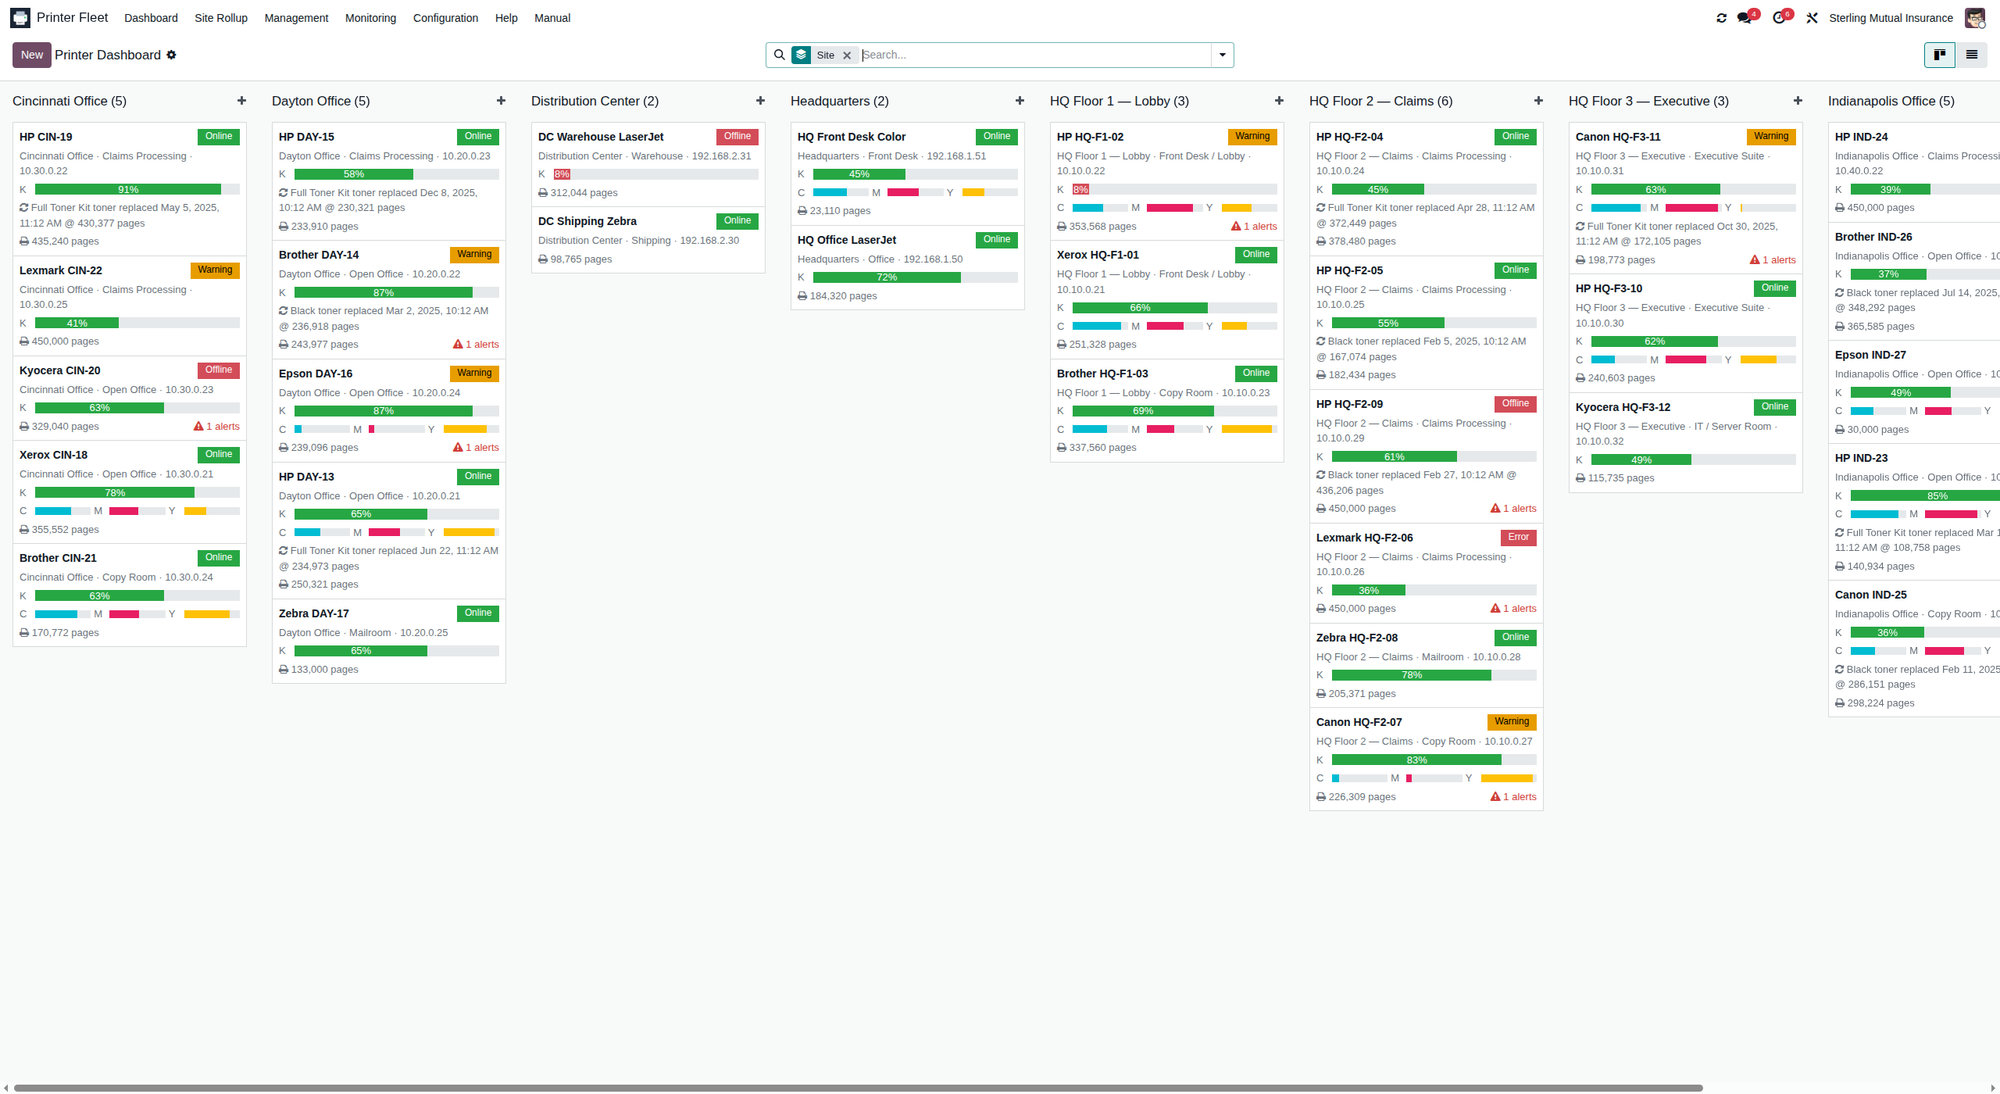
The list view is better for scanning a large fleet. Use the column sort and the search/filter bar (top right) to group by Site, Status, Printer Type, or filter to just the printers you care about. Click any row to open the printer record.
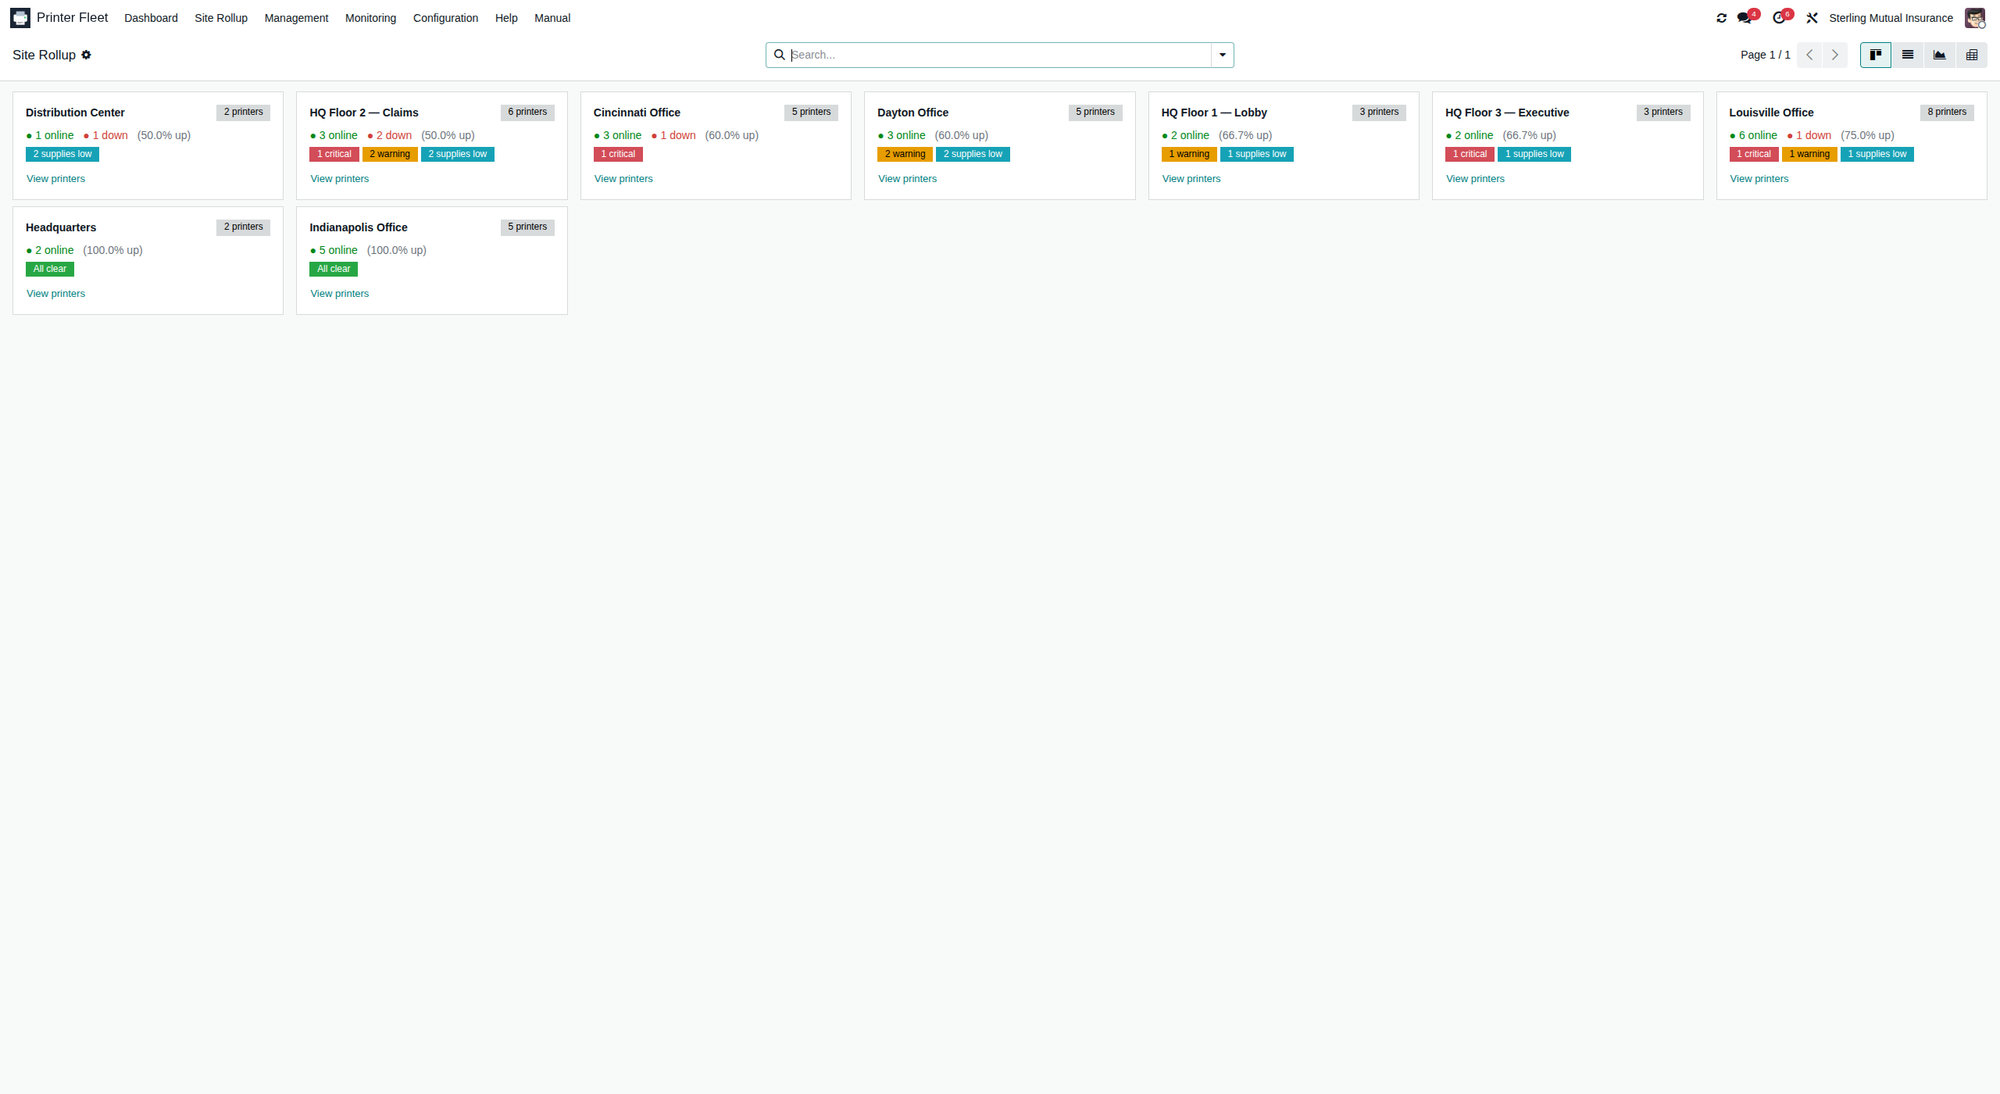
3.3 Site Rollup
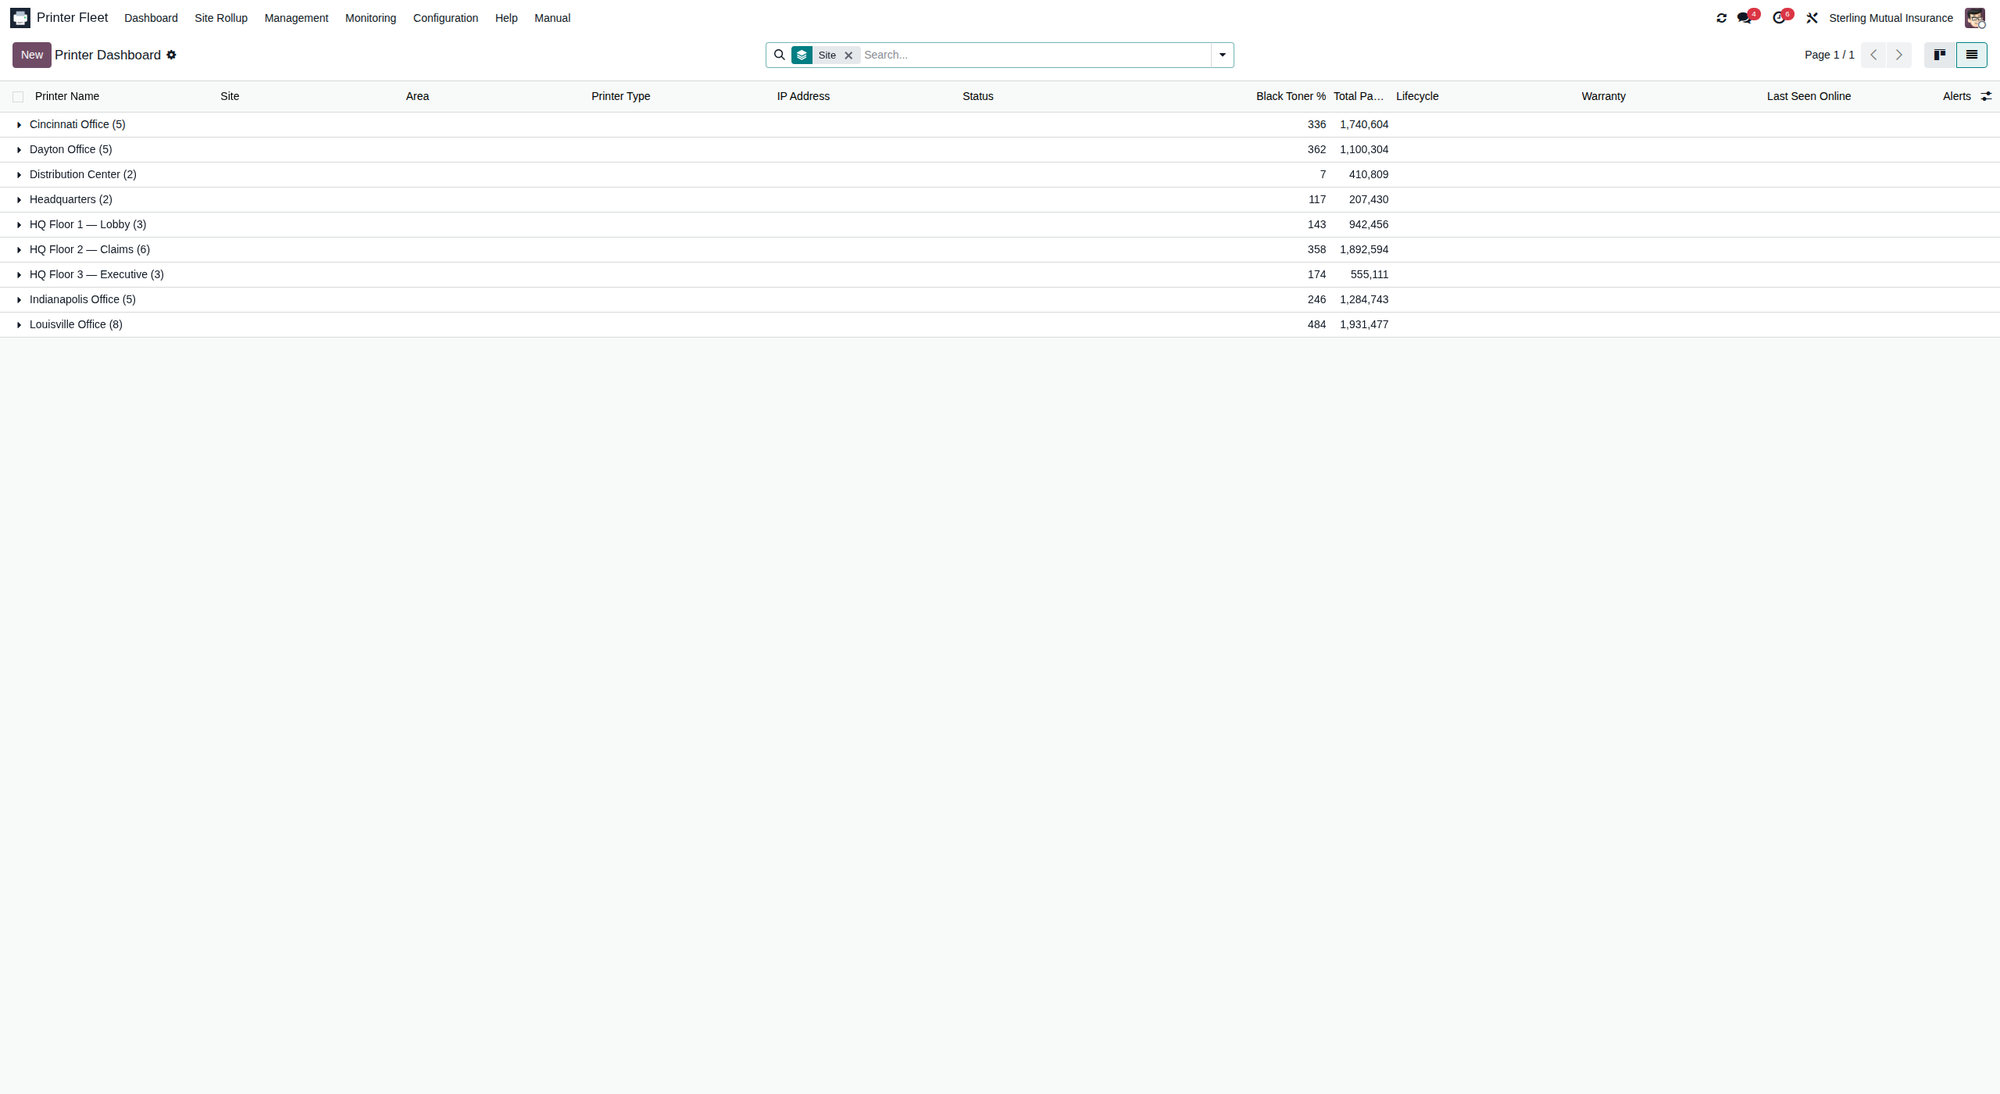
Printer Fleet → Site Rollup gives one line per site: how many printers are online, how many alerts are open, and aggregate supply health. Use it when you manage several buildings or branches and want the executive summary before drilling in.
4. Printer records
Printer Fleet → Management → Printers (or click any card/row on the dashboard).
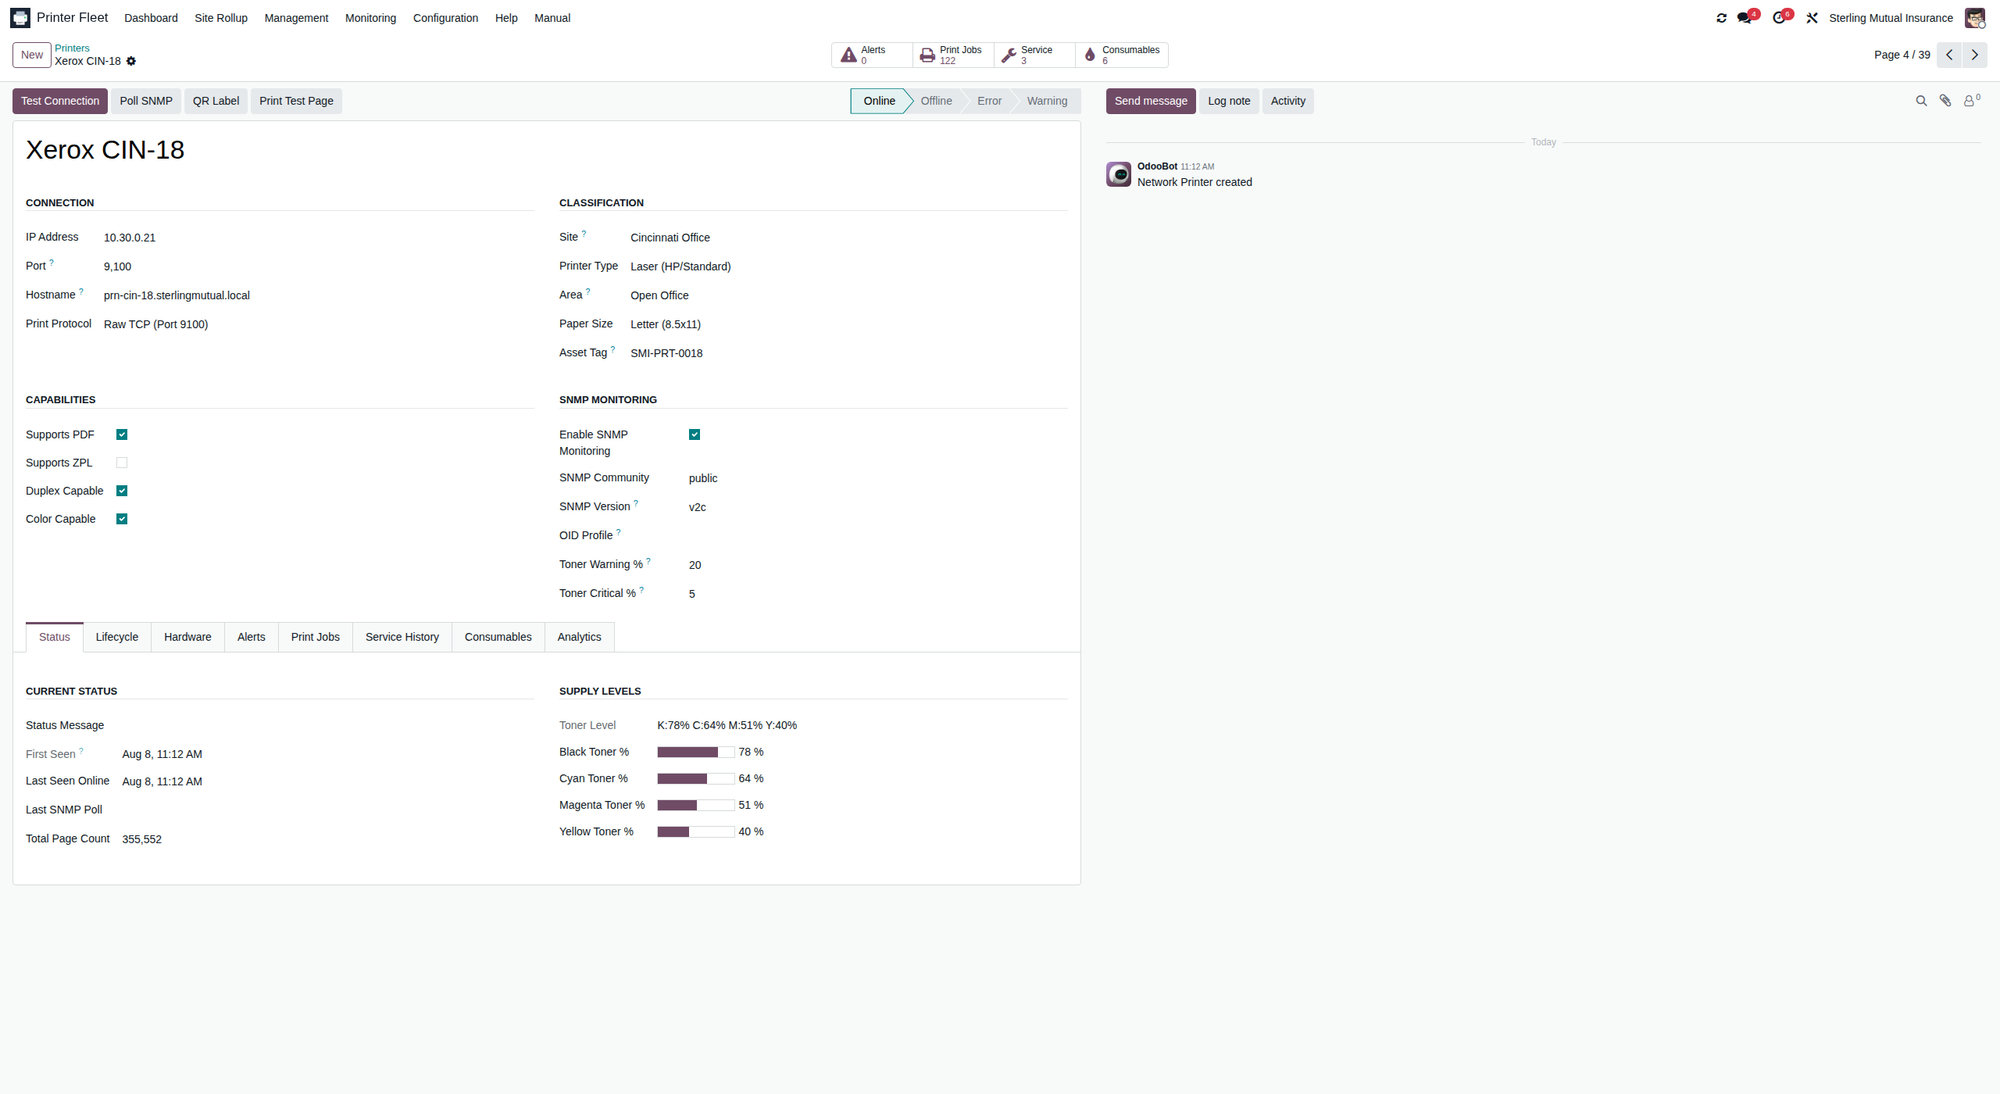
The printer form is the single source of truth for one device. Key fields and tabs:
4.1 Header and status
- Printer Name, IP Address, Port (9100 raw, or 631 IPP), Hostname
- Printer Type - Laser (HP/Standard), Label (Zebra/Dymo), Thermal Receipt, or Inkjet
- Site and Area - where the device physically lives
- Status, Status Message, Last Seen Online, Last SNMP Poll
- Live status indicators (the same badges shown on the kanban card)
The Test Connection button (top of the form) performs an immediate TCP reachability check to the printer's configured port and updates the status. Use it when you want an on-demand check rather than waiting for the next poll.
4.2 Toner and supplies
Toner levels (Black / Cyan / Magenta / Yellow) are kept current by the SNMP
poller. Each level is a percentage; -1/"Unknown" means the device has not
reported that supply. Non-toner life indicators - Drum Life %, Fuser
Life % - appear when known.
4.3 Lifecycle and warranty
PFM derives a Lifecycle state from the purchase date and expected life:
- New - under 10% of expected life used
- In Service - 10-75%
- Aging - 75-100%
- End of Life - at or over expected life
Warranty shows Under Warranty, Expiring Soon, Expired, or No Warranty Date, along with Warranty Days Left.
4.4 Related records (smart buttons / tabs)
From a printer you can jump to its Consumables, Alerts, Print Jobs, Service History, Status History, and page history. Counts are shown on smart buttons at the top of the form.
4.5 Print QR Label
The Print QR Label button generates a PDF label for the printer. You can select several printers in the list view and print labels in one batch. See §10 Mobile QR labels.
5. Supplies Grid, burn-rate and days-left
Printer Fleet → Monitoring → Supplies Grid
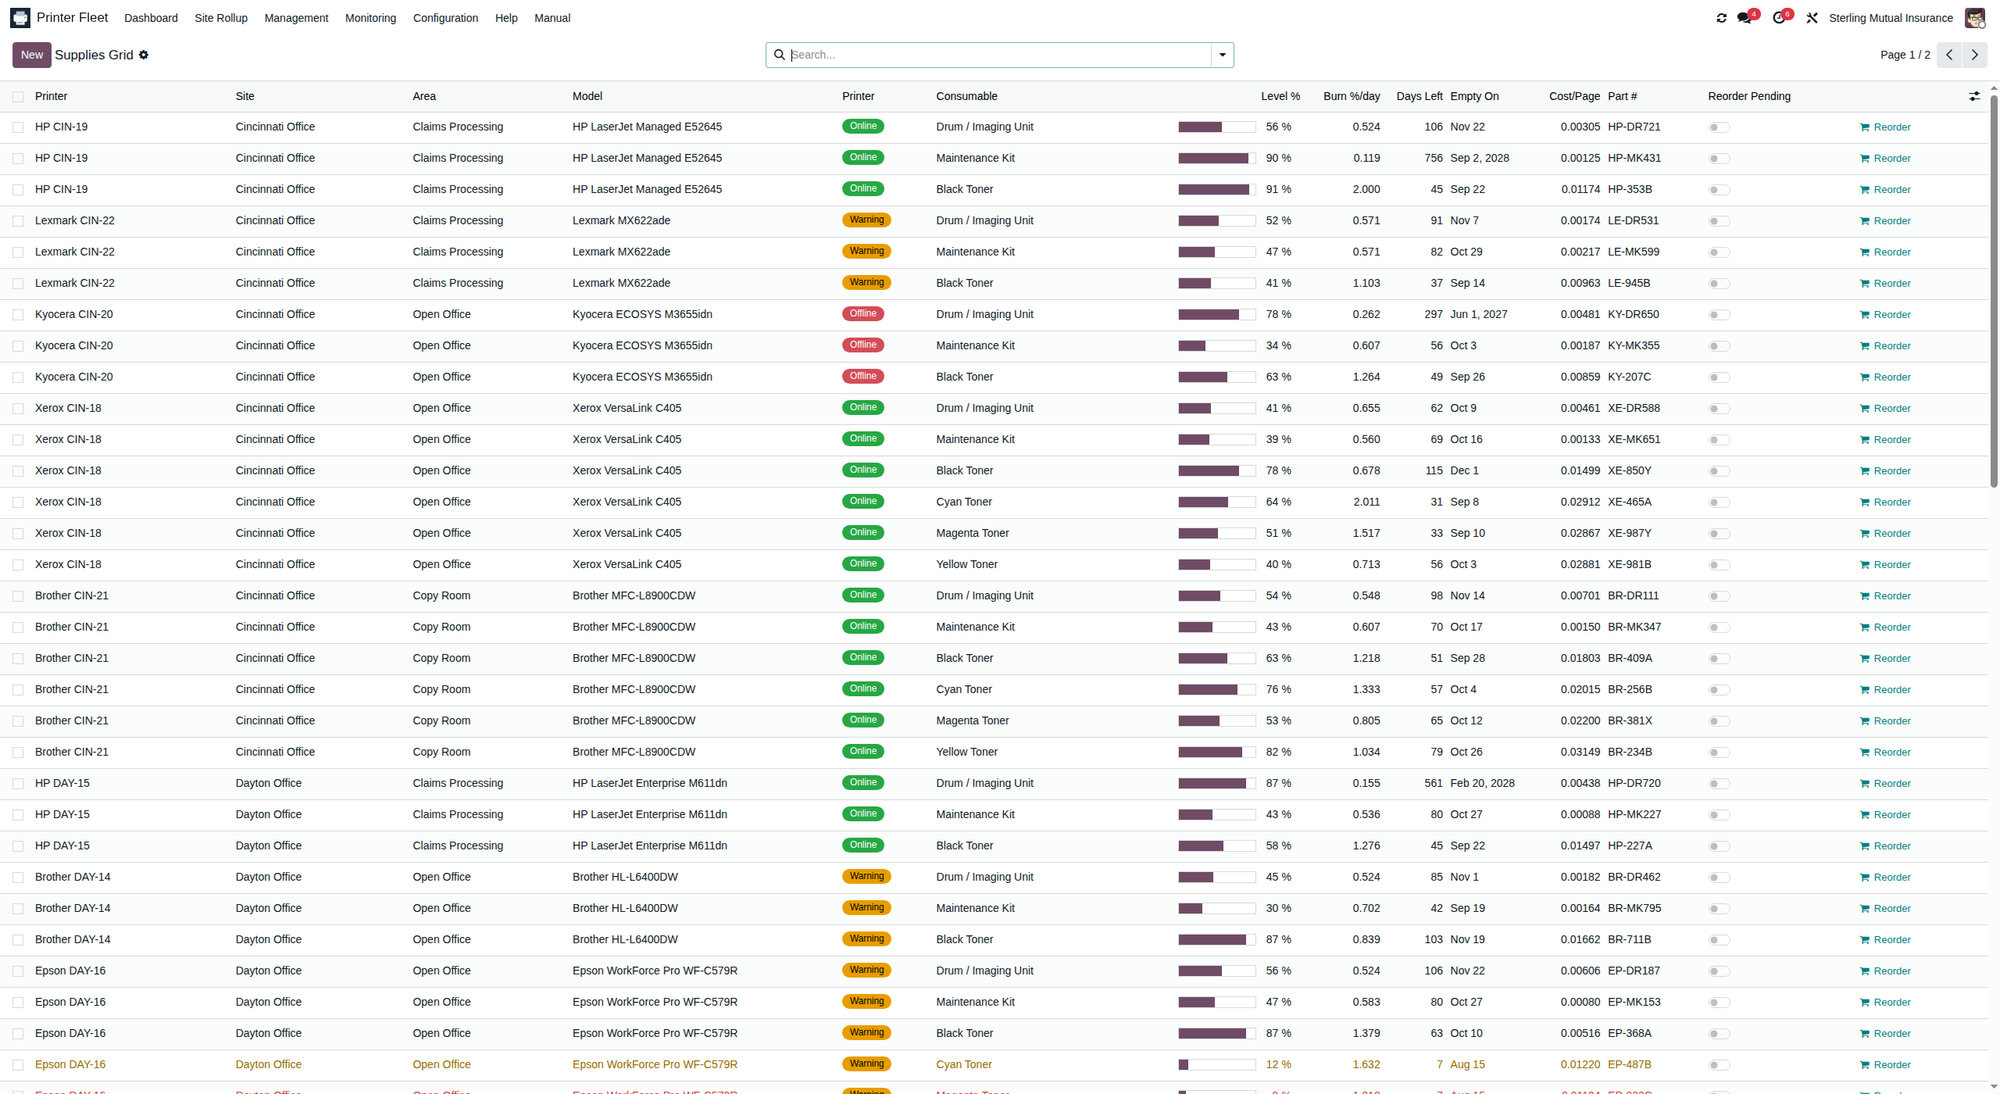
The Supplies Grid is the fleet-wide view of every tracked consumable - toner cartridges plus non-toner items (drum, fuser, maintenance kit, waste box). Each row is one consumable on one printer and shows:
- Consumable type and Printer
- Level % - current remaining level
- Burn Rate (%/day) - the average daily percentage drop, computed from the consumable's recorded level history
- Days Remaining - the estimated number of days until the consumable reaches 0%, based on the current burn rate
- Predicted Empty - the estimated calendar date it will run out
- Reorder Part # and Reorder Threshold %
Burn rate and the days/date predictions are calculated automatically from level snapshots taken over time. A brand-new consumable with no history yet will show a burn rate of 0 and no prediction until enough snapshots accumulate - this is normal for the first day or two of monitoring.
Tip. Sort the Supplies Grid by Days Remaining ascending to see what is about to run out first. This is the single most useful daily view for keeping the fleet stocked.
5.1 Low Toner Report and Reorder Report
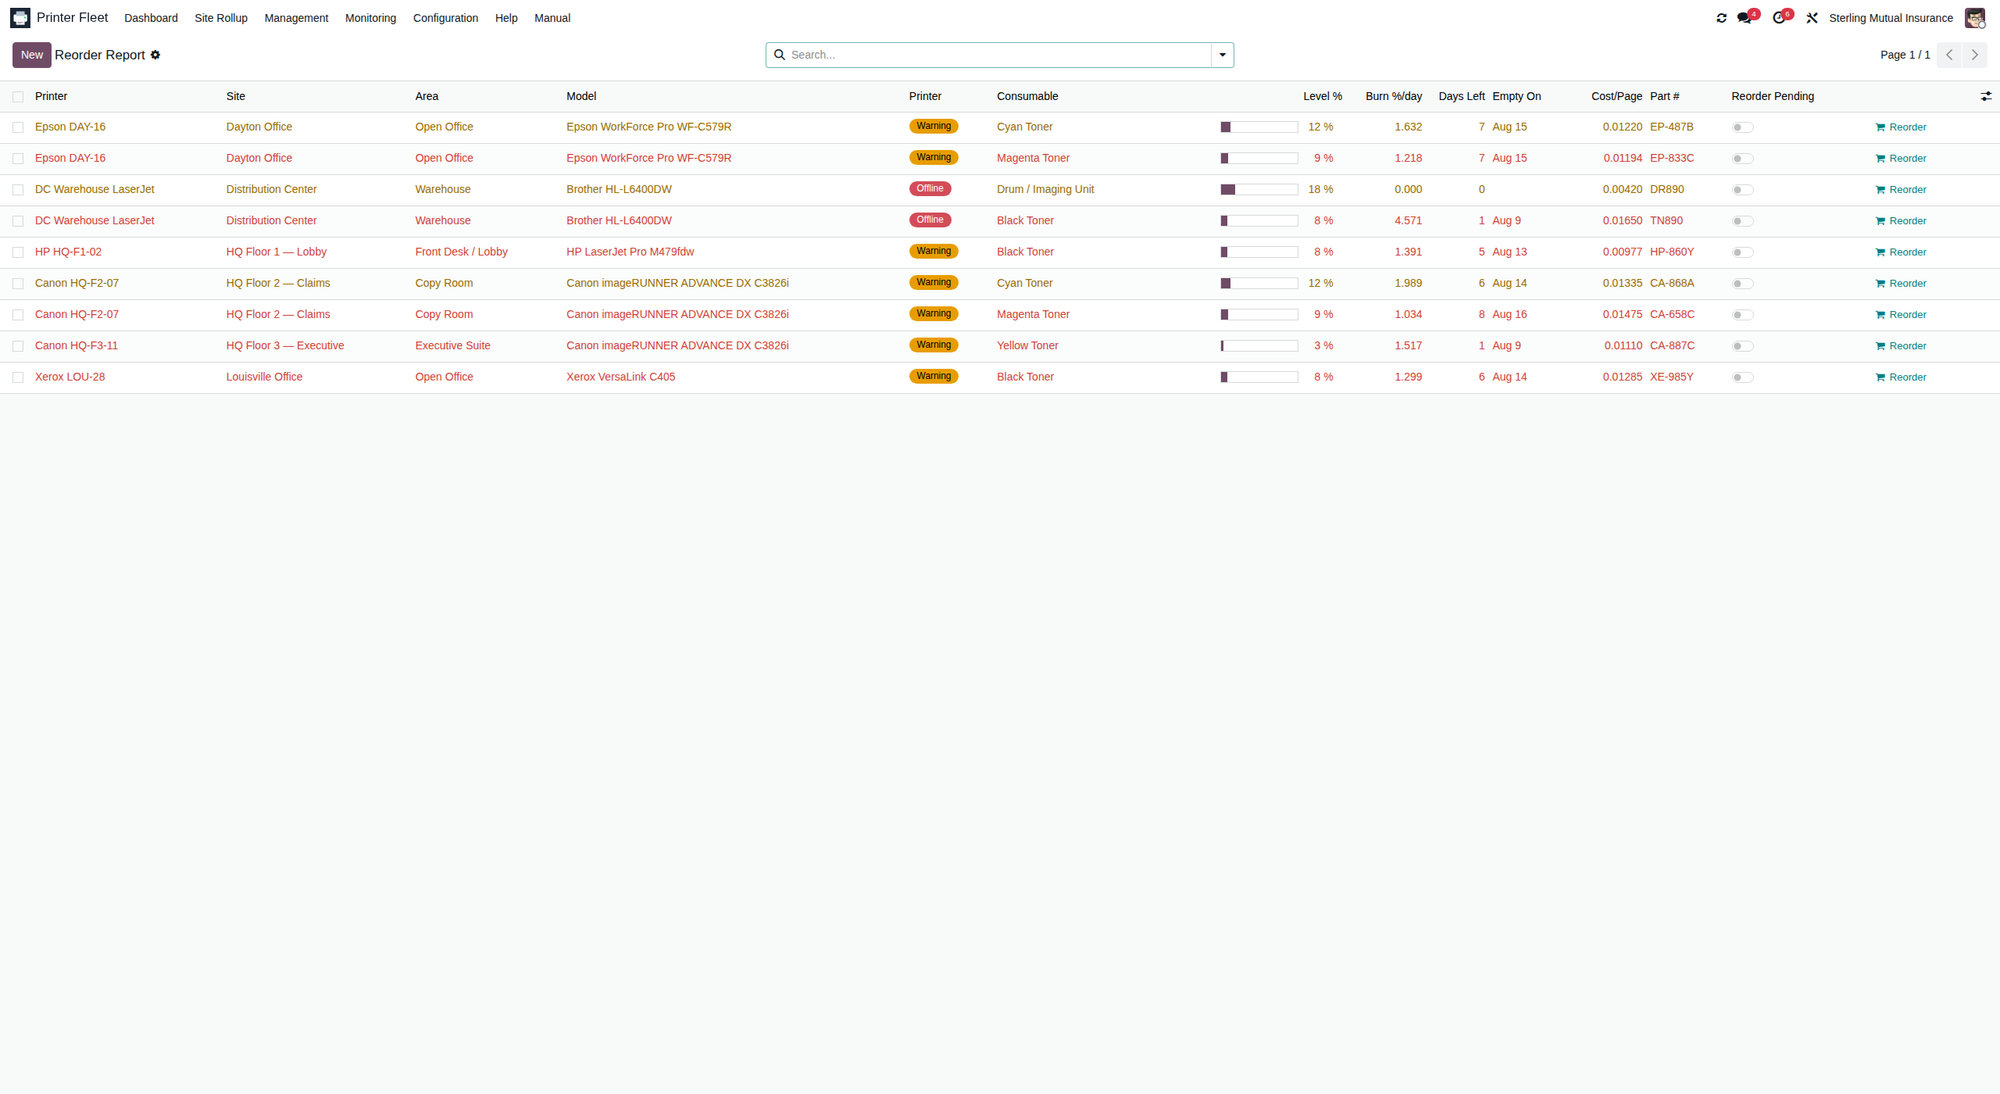
- Monitoring → Low Toner Report filters straight to printers whose toner is below threshold - a fast "who needs toner now" list.
- Monitoring → Reorder Report lists consumables at or below their reorder threshold. When a consumable crosses its threshold, PFM opens a reorder to-do activity once per low episode; it clears automatically when the consumable is replenished above threshold.
6. Alerts - acknowledge and resolve
Printer Fleet → Monitoring → Alerts
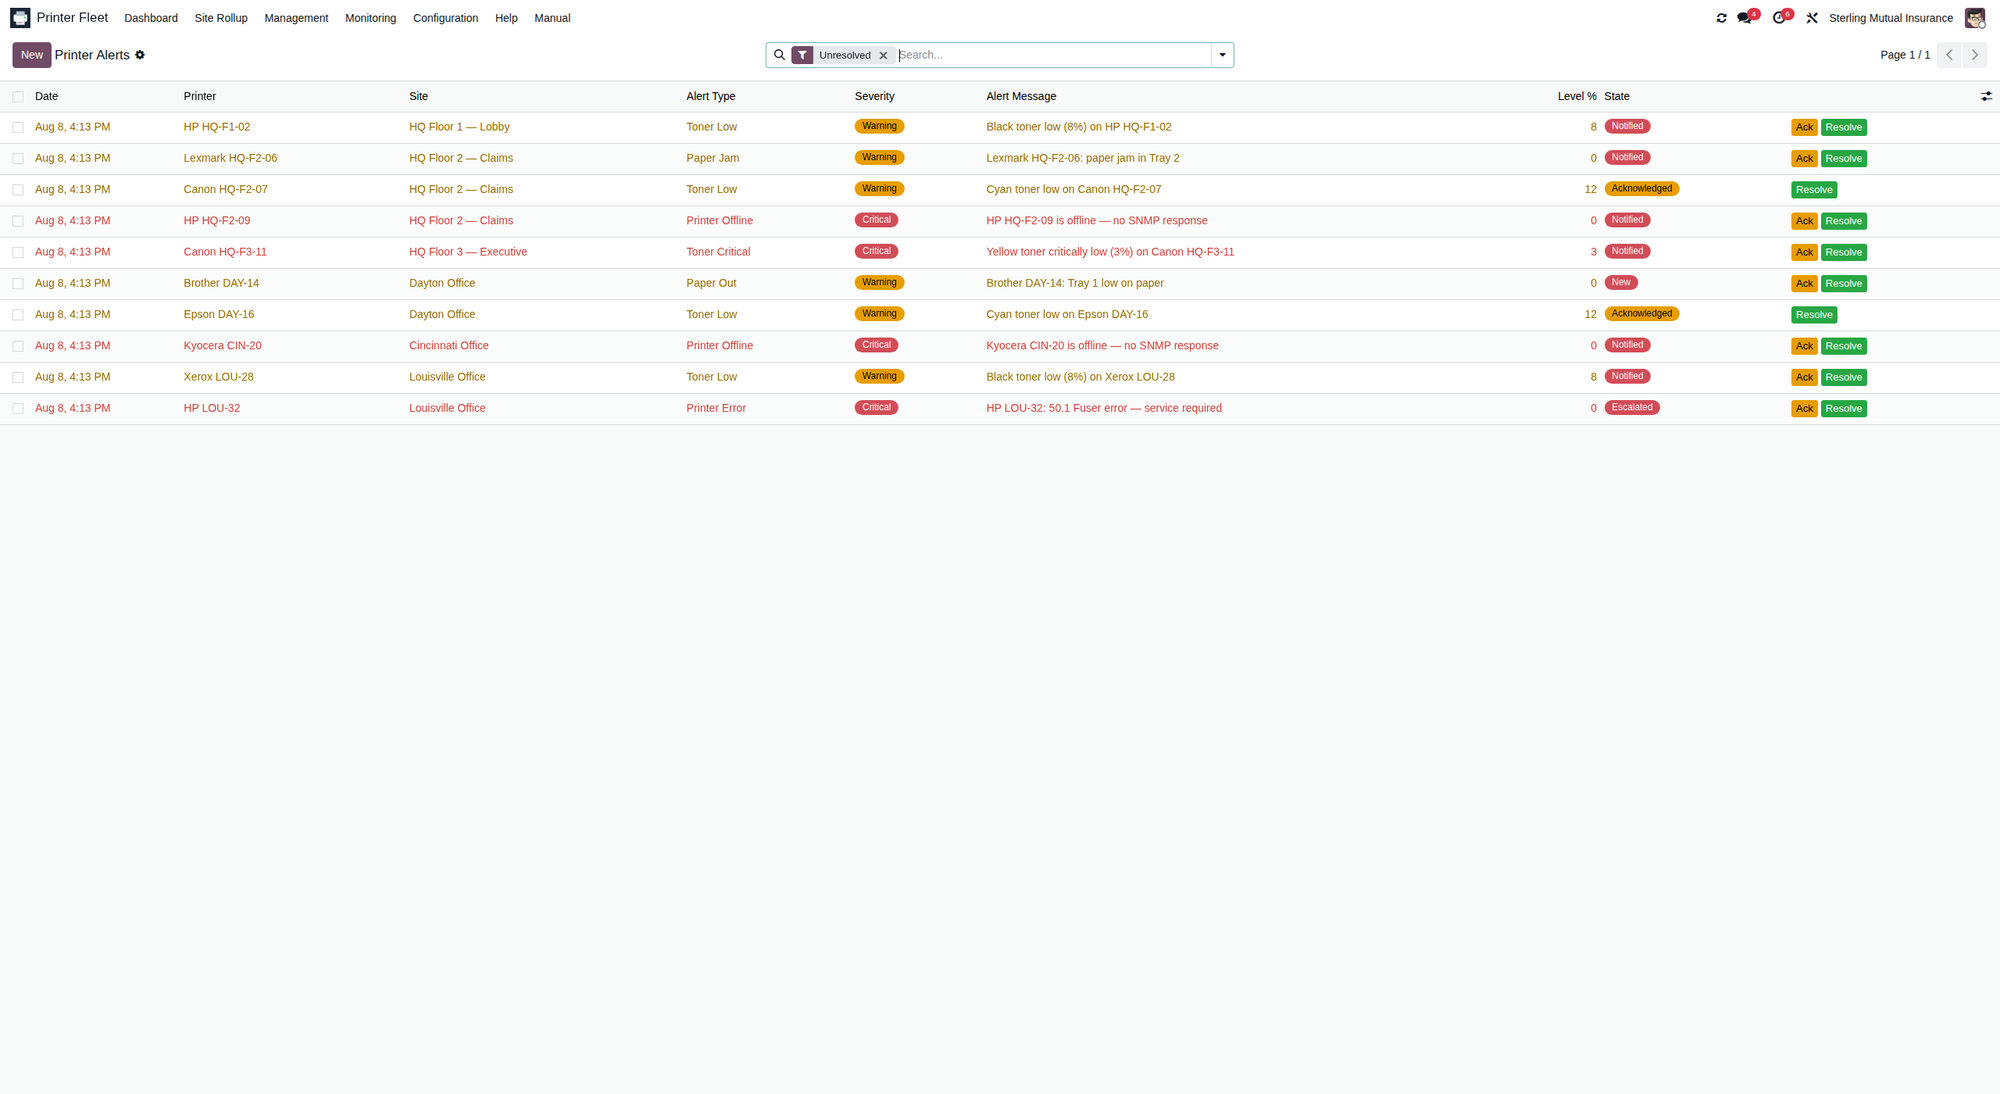
PFM raises alerts automatically from SNMP polling and supply checks. Alerts are de-duplicated (you get one per condition per printer) and auto-resolved when the underlying problem clears - for example, a toner-low alert resolves itself after the cartridge is changed and the next poll sees a healthy level.
6.1 Alert types and severity
Types: Toner Low, Toner Critical, Toner Empty, Supply Low, Supply Critical, Paper Out, Paper Jam, Printer Offline, Printer Error, Door Open, Warranty, Maintenance Required.
Severity: Info, Warning, or Critical.
6.2 Alert lifecycle (states)
Each alert moves through a clear state machine:
| State | Meaning |
|---|---|
| New | Just created, not yet dispatched |
| Notified | Notifications have been sent; awaiting a human |
| Acknowledged | Someone has taken ownership of it |
| Escalated | A critical alert went unacknowledged past the escalation delay |
| Resolved | The condition cleared (automatically or manually) |
6.3 Acknowledge
Open an alert and click Acknowledge. This records who acknowledged it and when, and stops it from escalating. Acknowledge an alert when you have seen it and are handling it - for example, you are on your way to change the toner.
6.4 Resolve
Click Resolve when the issue is fixed. This stamps the resolved date. In most cases you will not need to resolve manually - PFM auto-resolves supply, offline, and error alerts once the next poll confirms the condition is gone.
6.5 Reopen
If an alert was resolved but the problem is back, open it and click Reopen; it returns to the Notified state. (Usually you can just let the next poll re-raise it.)
Filtering. Use the search bar to view only Critical alerts, only a given Site, or only unresolved alerts. Save a custom filter as a favourite for one-click daily triage.
7. Service history
Printer Fleet → Monitoring → Service History
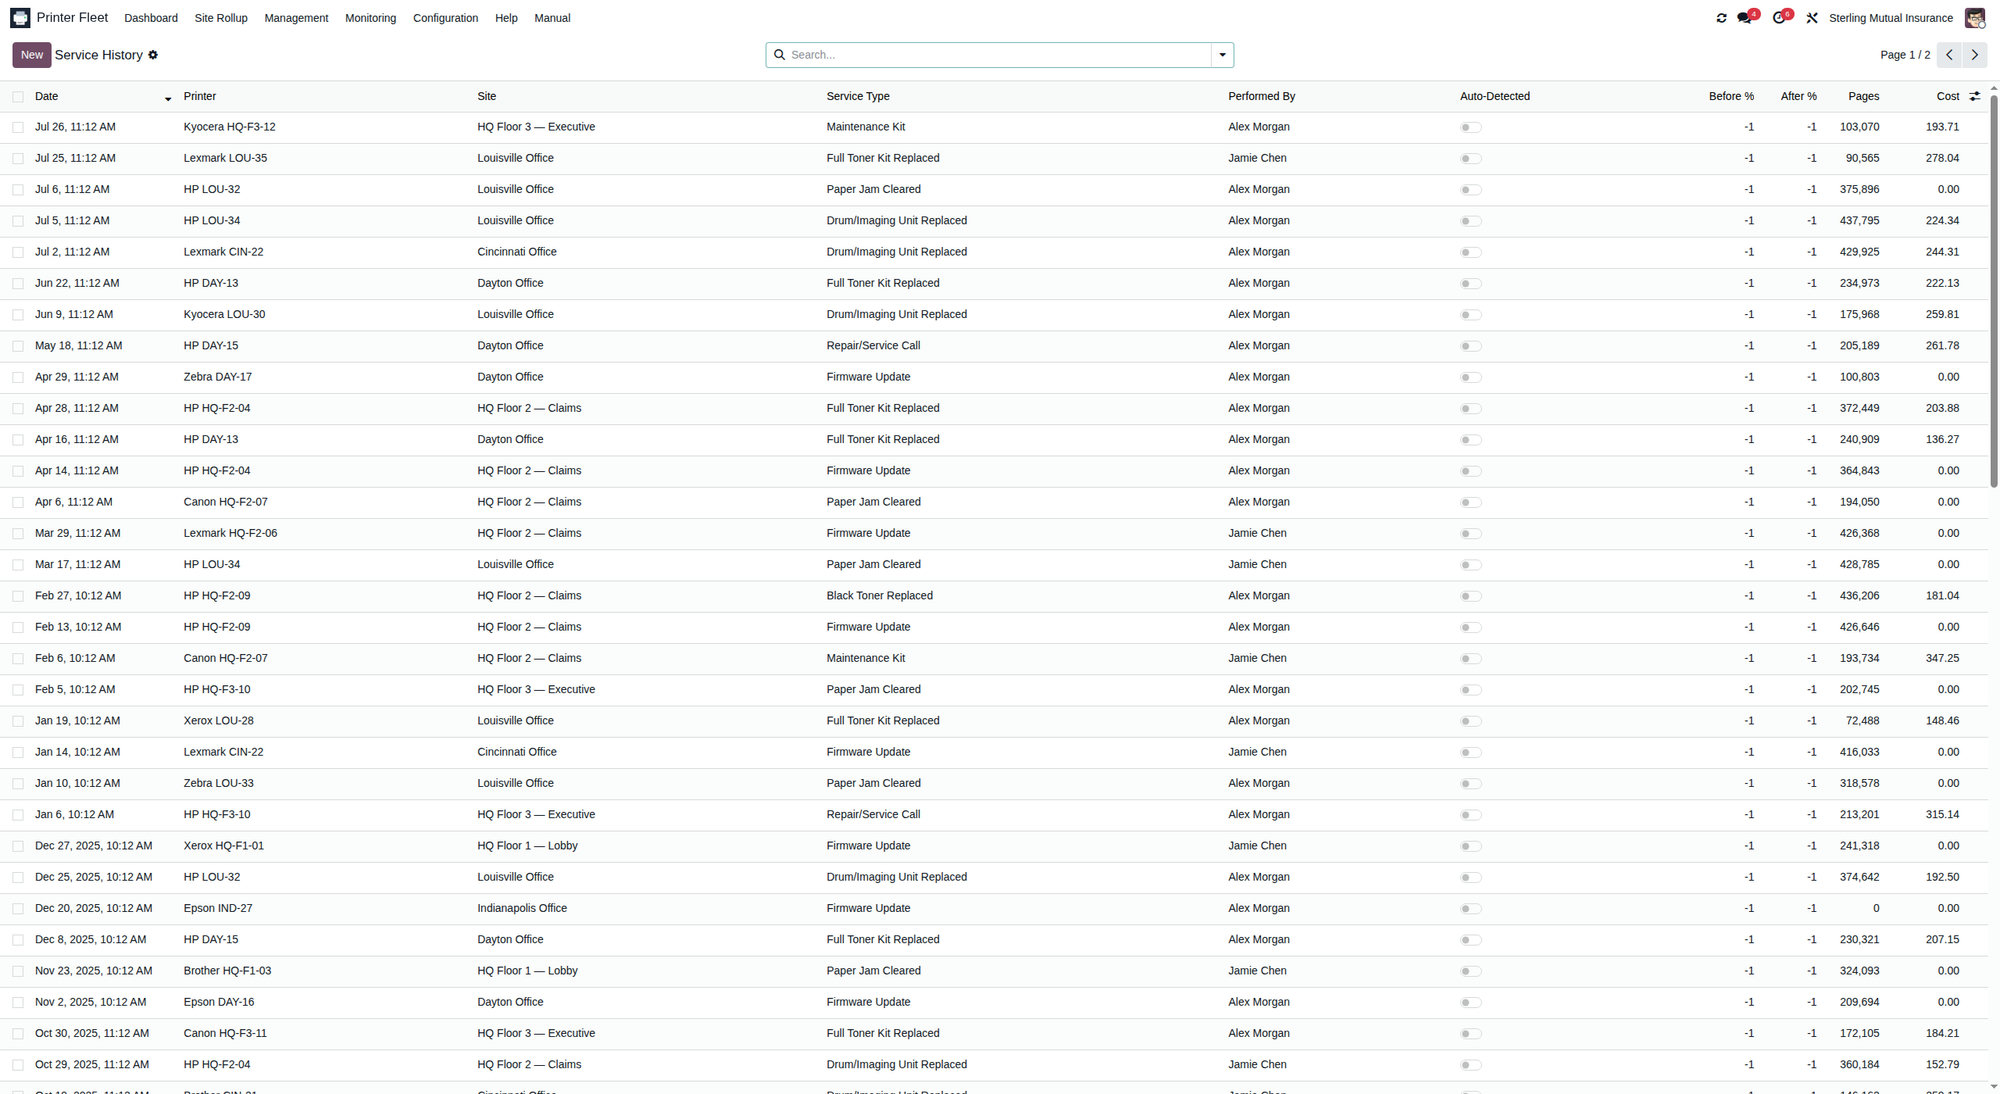
Every consumable change and repair is logged here. Records capture the Printer, Date, Service Type, Performed By, page count at service, cost, vendor, and part number.
Service types: Black / Cyan / Magenta / Yellow Toner Replaced, Full Toner Kit Replaced, Drum/Imaging Unit Replaced, Fuser Kit Replaced, Maintenance Kit, and Repair/Service Call.
7.1 Auto-detected toner changes
When SNMP sees a toner level jump upward by more than the configured detection threshold between polls, PFM automatically logs a toner replacement and marks it Auto-Detected. You do not have to log routine cartridge swaps by hand - but you can add notes, cost, and part numbers to any record afterwards.
7.2 Logging service manually
To record a repair or a service call, create a new Service History record (or use the Service History smart button on the printer form), pick the Service Type, and fill in the date, notes, cost, and any RMA details if a part is going back to a vendor.
7.3 Service Costs
Monitoring → Service Costs rolls up spend per printer - lifetime and trailing 12 months - and shows a cost per page figure, useful for spotting expensive-to-run devices.
8. Usage and volume reports
PFM ships several analytical views under Monitoring:
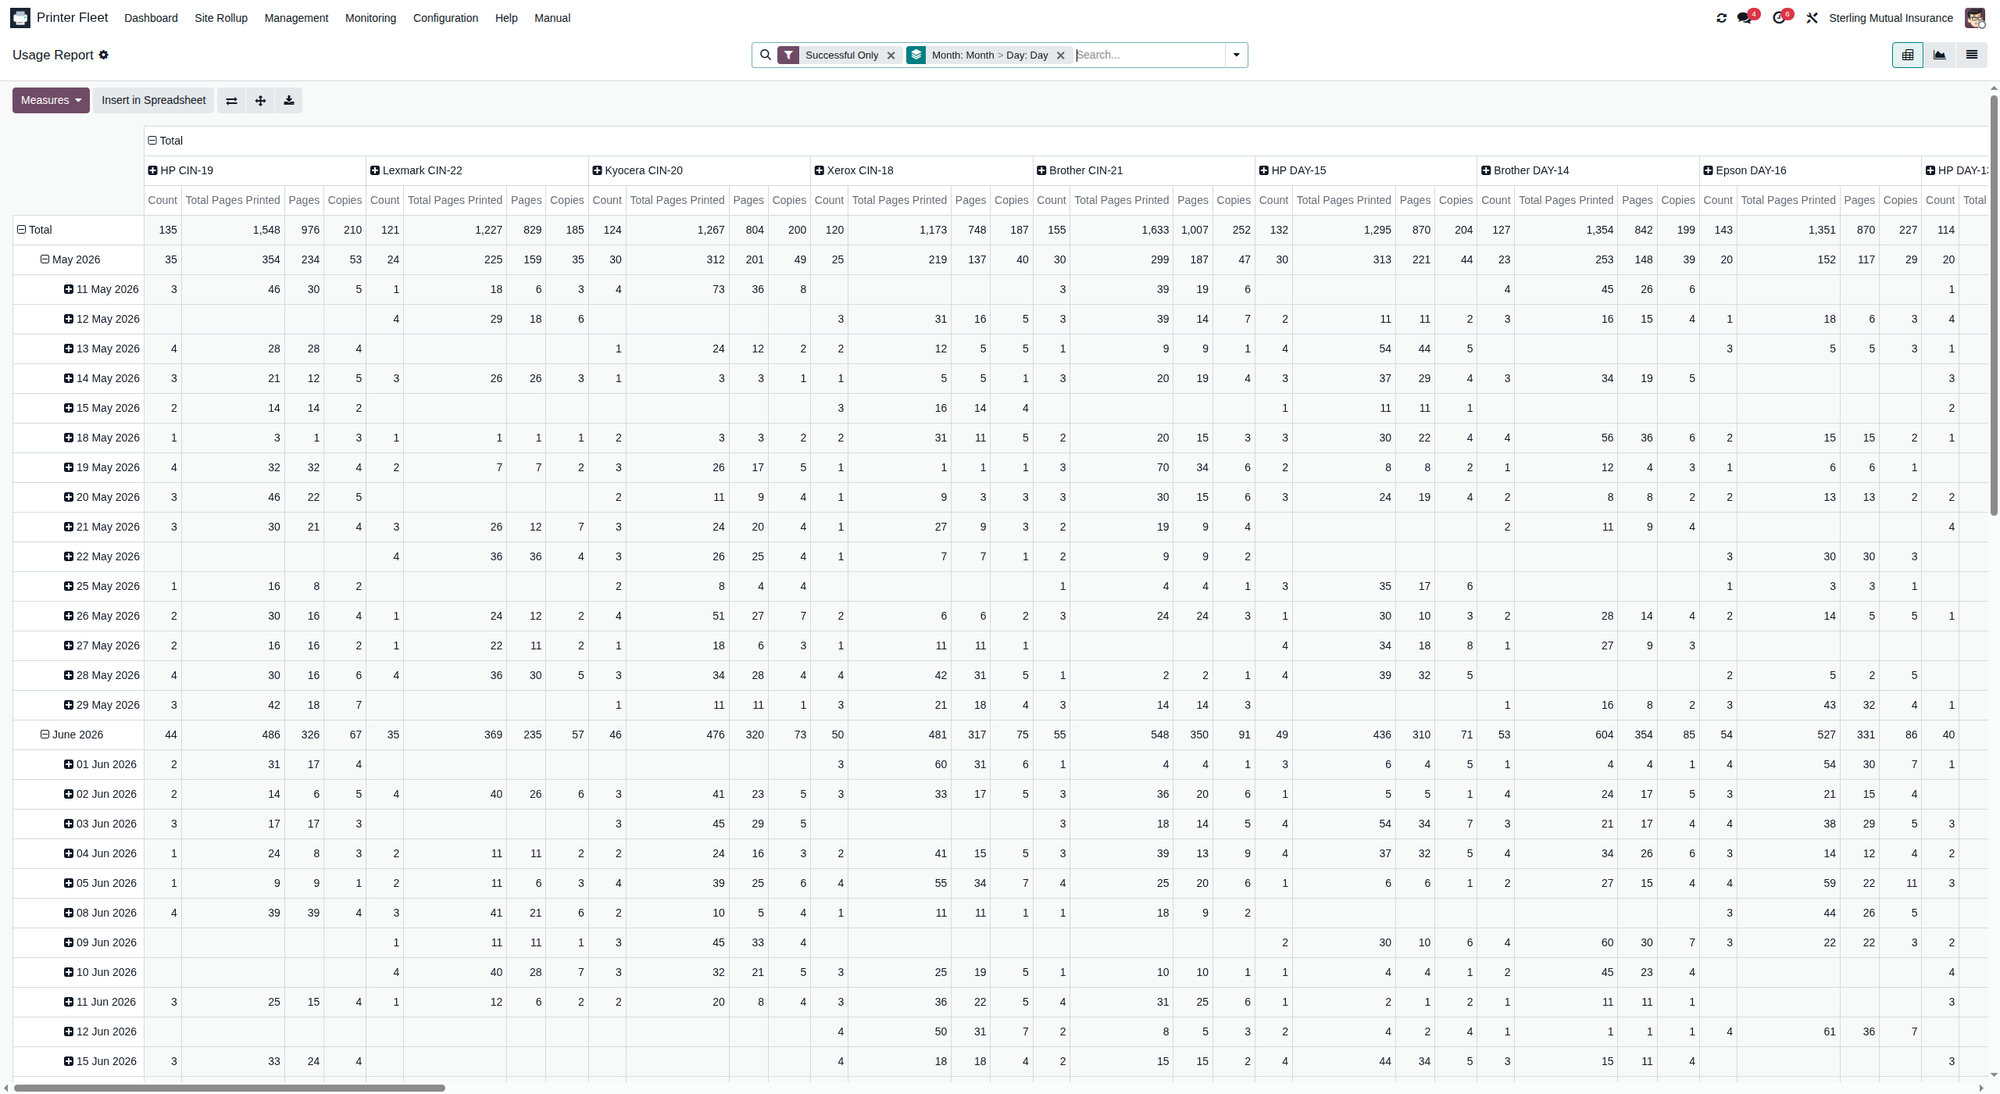
- Usage Report - pivot and graph views of print volume, sliced by printer, site, user, and document type. Use the pivot to build custom breakdowns; use the graph for a quick visual.
- Volume Trend - daily page-count deltas over time, the basis for the Pages-7d and Pages-30d figures on printer records.
- Status History - a timeline of every online/offline/error transition, which also feeds the uptime percentages (7-day and 30-day) shown on printers.
Uptime and volume figures on the printer form (Uptime 7d/30d, Pages 7d/30d) are only as complete as the history behind them. They fill in over the first weeks of monitoring once the daily snapshot and status-log crons have been running.
9. Wallboard kiosk
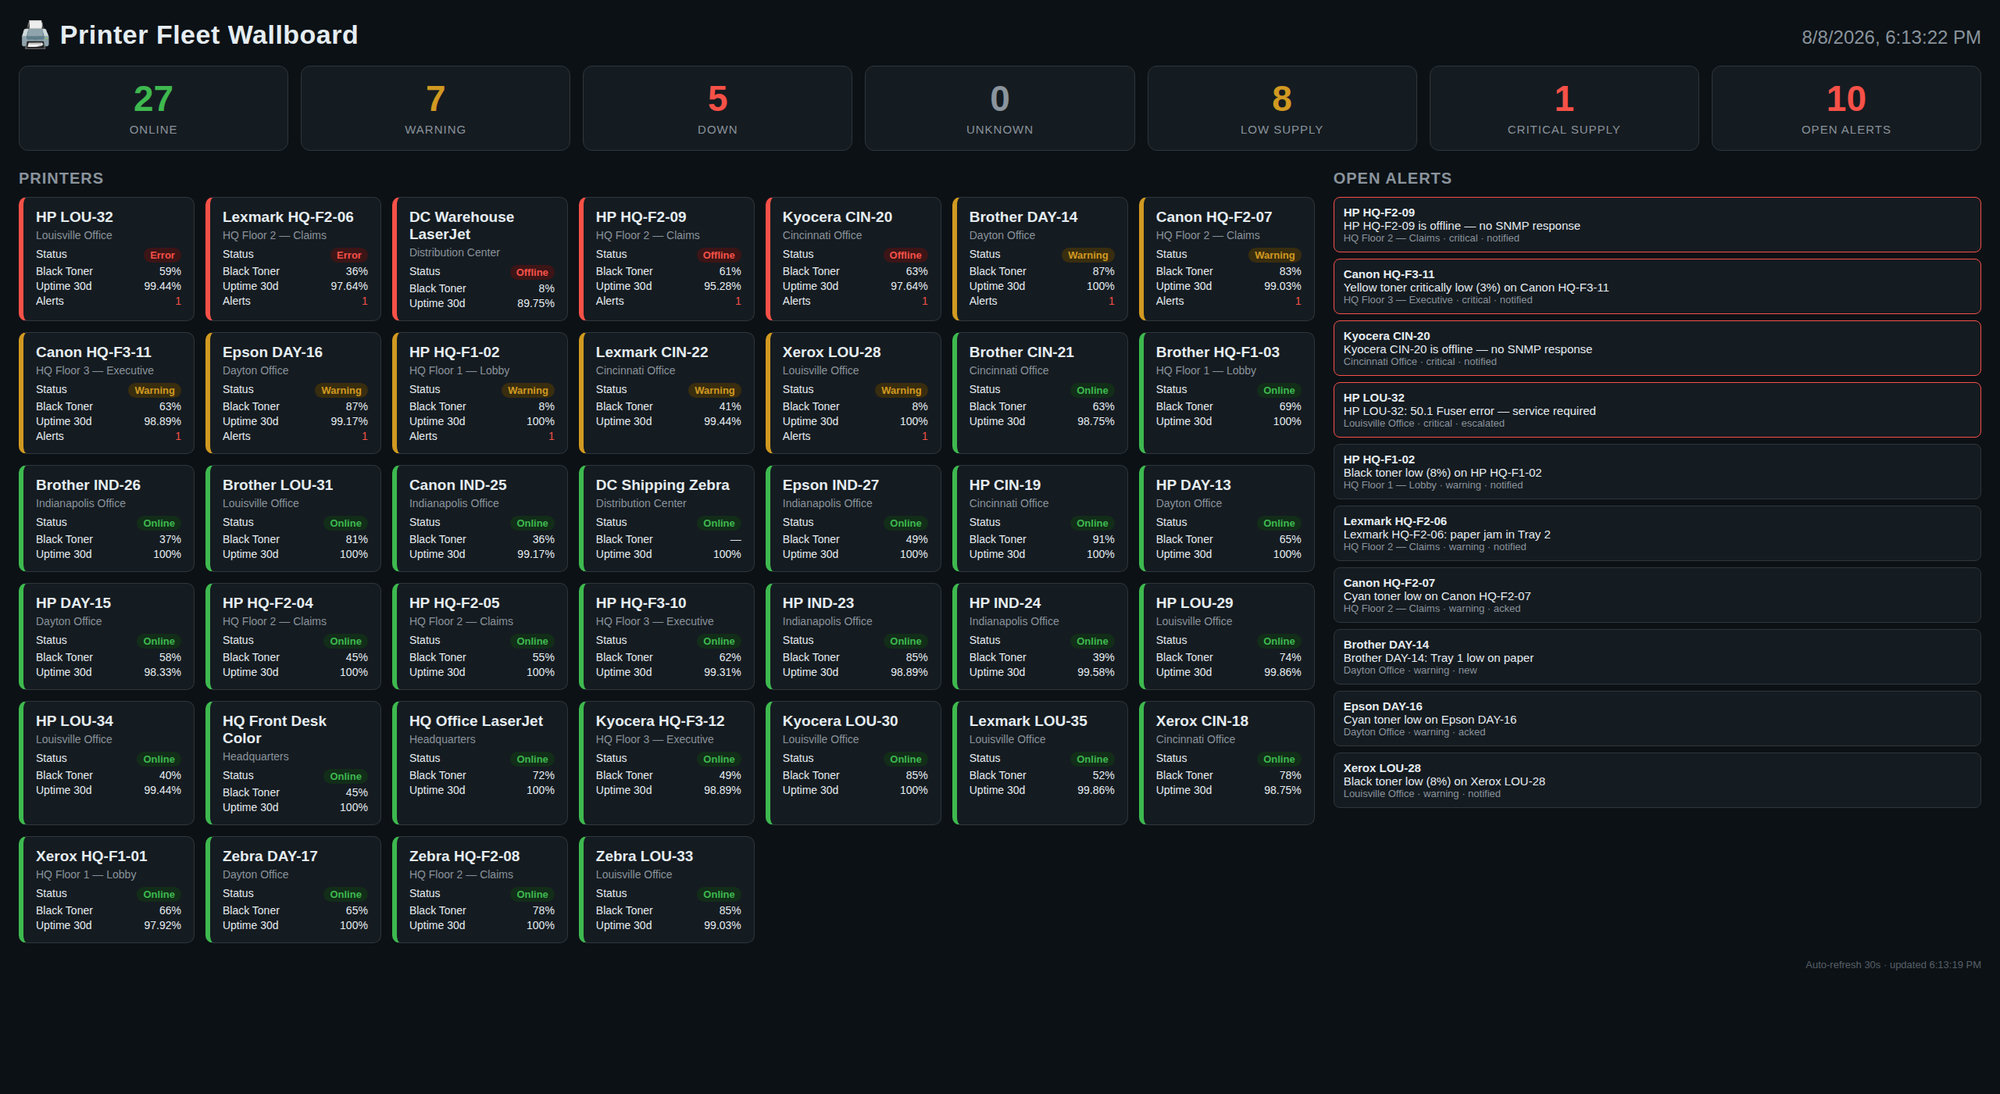
The wallboard is a full-screen, read-only, auto-refreshing fleet status page designed for a hallway TV or a dedicated kiosk. It does not require anyone to log in - access is guarded by a kiosk token that an administrator sets up.
To display it, browse the kiosk device to:
https://YOUR_ODOO_HOST/printer_fleet/wallboard?token=YOUR_TOKEN
On first load the token is moved into a secure browser cookie and the URL is
cleaned up, so you can bookmark the bare …/printer_fleet/wallboard address.
The page refreshes on its own; leave it running.
If you see "403 - invalid or missing kiosk token", the token is wrong, missing, or has not been configured yet - ask your administrator (see the Admin Guide, Wallboard section).
10. Mobile QR labels
Every printer can carry a printed QR label. A technician standing at the device scans the label with a phone and is taken straight to that printer's mobile technician page in Odoo.
10.1 Printing labels
From a printer form, click Print QR Label, or select several printers in the
list view and print labels as a batch. The label is a PDF; label QR images
require the qrcode library and PDF export requires wkhtmltopdf (both are set
up by your administrator).
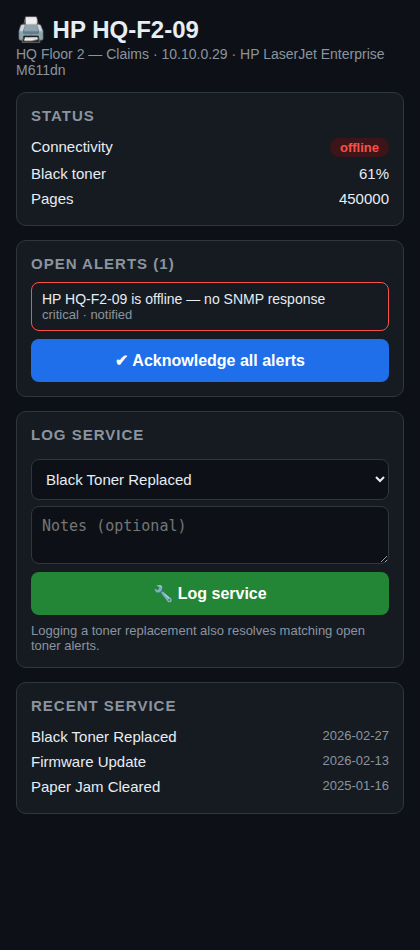
10.2 The mobile technician page
Scanning the QR opens …/printer_fleet/mobile/<printer id>. You must be logged
in to Odoo (the page authenticates as a normal user), so log in once on the
phone and future scans go straight through.
The mobile page is a stripped-down, phone-friendly view of one printer that lets a technician standing at the device do two things without hunting through the backend:
- Acknowledge alerts - one tap acknowledges all open alerts on that printer.
- Log service - pick a service type (toner colour, toner kit, drum, fuser, maintenance kit, or repair) and submit. Logging a toner replacement also closes any matching open toner alert for that colour; the next poll re-raises it only if the level is genuinely still low.
The page also shows recent open alerts and the last few service records for context.
11. My Notifications
Printer Fleet → Monitoring → My Notifications
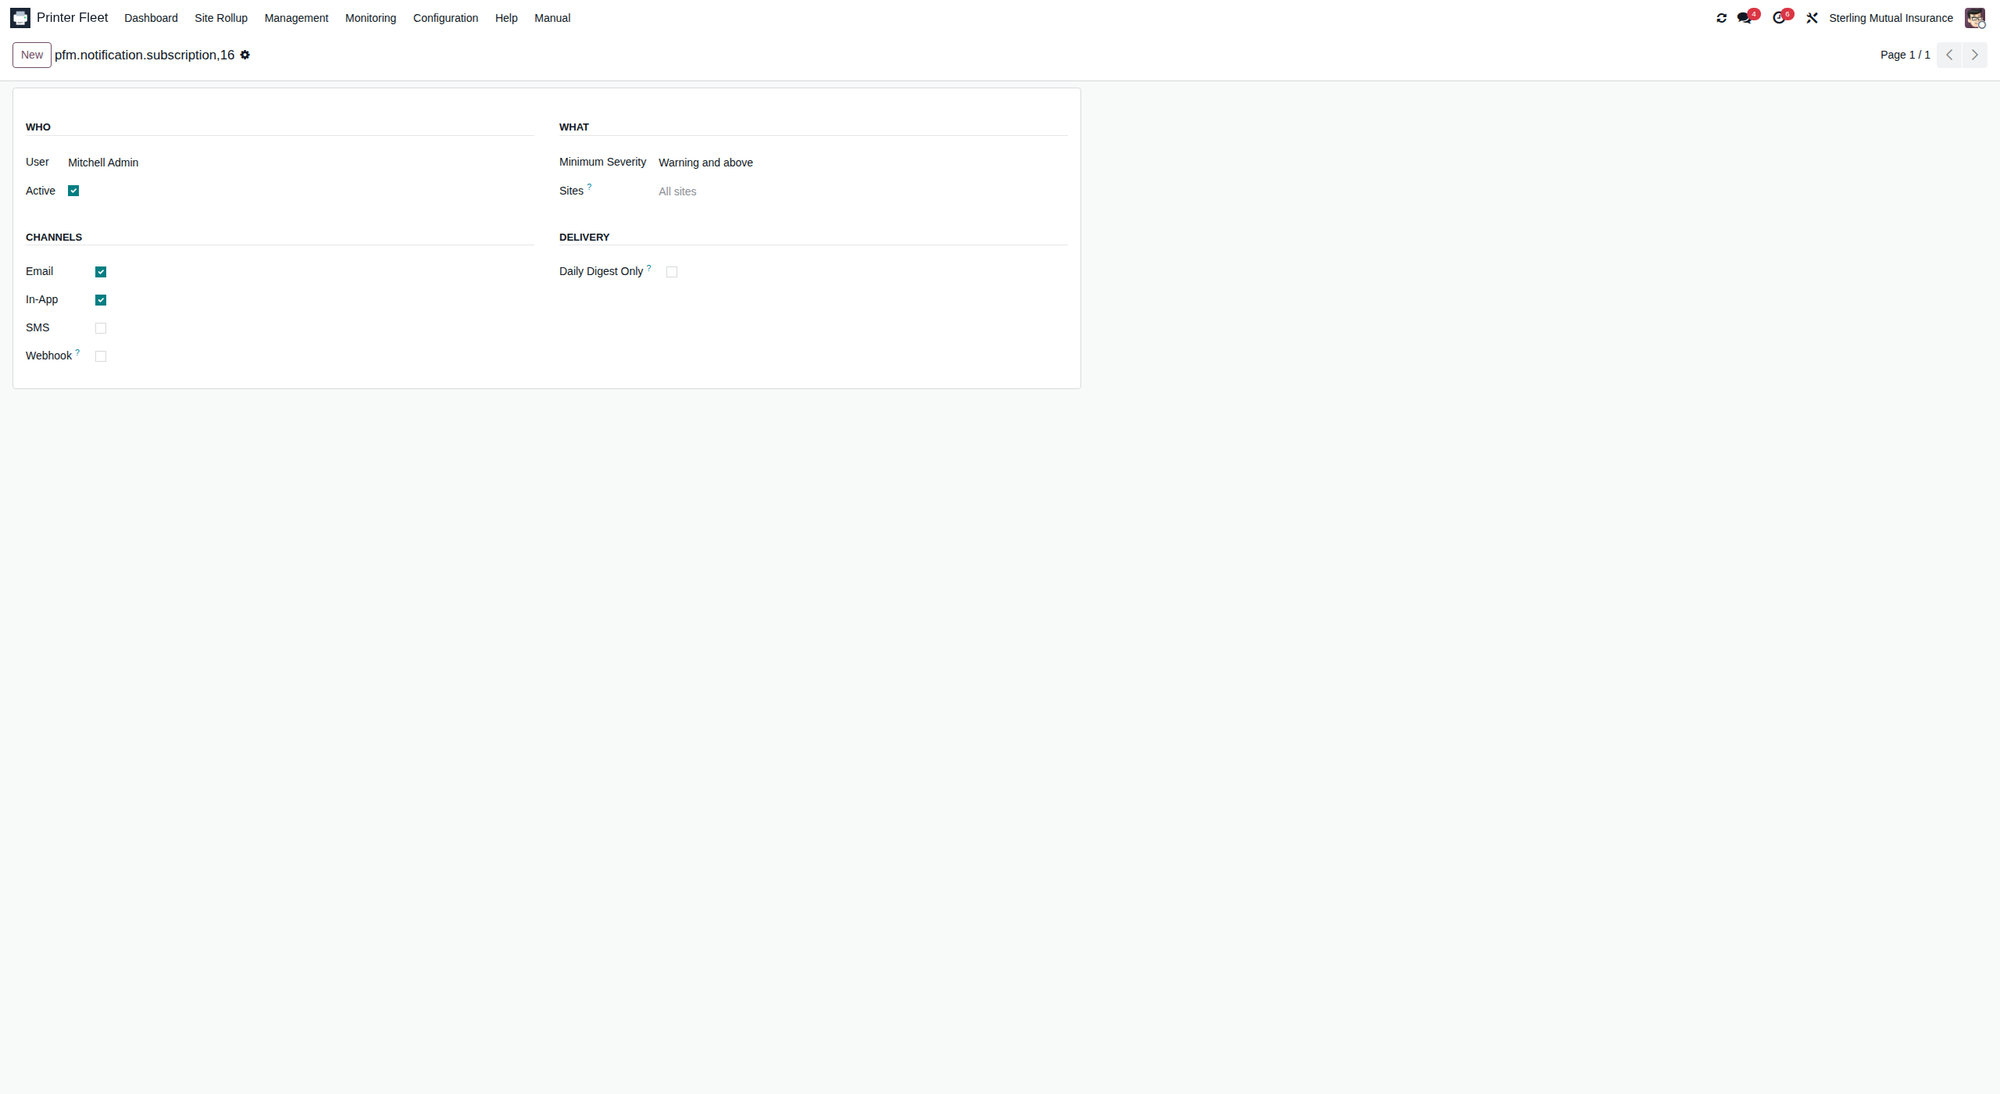
This opens your own notification subscription so you can control how PFM alerts reach you. You choose:
- Sites you care about (leave empty for all)
- Minimum Severity - All (info, warning, critical), Warning and above, or Critical only
- Channels - Email, In-App, and (if enabled by an admin) SMS. Webhook routing is manager-only.
- Digest mode - batch your alerts into a single daily summary email instead of one message per alert.
You can only edit your own subscription; you cannot see or change a colleague's routing. If you enable SMS you must supply your own destination number.
12. Everyday workflows
Morning fleet check 1. Open the Dashboard (kanban) and scan for red/amber badges. 2. Open Alerts, filter to unresolved criticals, and Acknowledge the ones you are taking. 3. Open the Supplies Grid, sort by Days Remaining, and pull anything due to run out soon.
Changing toner at a device 1. Scan the printer's QR label with your phone. 2. On the mobile page, tap Log Service → choose the toner colour → submit. 3. Matching toner alerts close automatically; the next poll confirms the new level.
Handling an offline printer 1. Open the printer, click Test Connection. 2. If still offline, check power/network at the device; the alert auto-resolves once it is reachable again.
13. Getting help
- Printer Fleet → Help and Printer Fleet → Manual contain the built-in, in-app documentation.
- For product support, contact [email protected].
ModuleSmith Printer Fleet Manager 19.0.7.1.1 - © ModuleSmith. Licensed under OPL-1.